INTRO
There are several software packages used in processing VLF signals. Vlfrx-tools by Paul Nicholson is a very powerful package. This article describes the software aspect, while previous KLUBNL.PL articles described equipment used with vlfrx-tools:
Simple 1PPS signal source and distribution amplifier
Simple setup for monitoring of VLF signals using vlfrx-tools
This article is not supposed to be a manual for vlfrx-tools (because there already is a very good manual), nor for unix/linux systems (because there is a lot of good documentation for them too), it’s a description of my setup, which yields useful results. Please refer to previous articles for the hardware setup: the VLF signal is sampled using an external Creative EMU-0204 USB sound card, the sampling rate is compensated using a 1PPS signal from a GPS receiver.
INSTALLING VLFRX-TOOLS AND EBNAUT
The vlfrx-toolspackage is avaliable at:
http://abelian.org/vlfrx-tools/ (the current version when this article was written was 0.7p)
Before installation one should read the vlfrx-tools user manual.
The installation was done on a Debian GNU/Linux 8 64-bit system (other linux distributions and processors will work as well, but you’re on your own). The install procedure differs from the orginalnej instructions because the software is installed in /opt/vlfrx :
apt-get update

apt-get upgrade #so that we have an up-to-date system

apt-get install build-essential
apt-get install libasound2-dev libvorbis-dev libflac-dev libx11-dev libpng12-dev libxpm-dev libncurses5-dev libforms2 libforms-dev libshout3-dev libsamplerate0-dev libfftw3-dev sox gnuplot

mkdir -p /opt/vlfrx/bin

#download the ebnaut decoder
wget http://abelian.org/ebnaut/ebnaut.c
gcc -std=gnu99 -Wall -O3 -lpthread -lm -mtune=native -march=native -mcpu=native ebnaut.c -o /opt/vlfrx/bin/ebnaut


#download and unpack the .tar.gz archive with the vlfrx-tools source code
#NOTICE: you should download the latest version from http://abelian.org/vlfrx-tools/
#currently this is 0.7p

wget http://abelian.org/vlfrx-tools/vlfrx-tools-0.7p.tgz
tar xzf http://abelian.org/vlfrx-tools/vlfrx-tools-0.7p.tgz
cd vlfrx-tools-0.7p
./configure --prefix=/opt/vlfrx
make
make install
We are installing to /opt/vlfrx , because we want all files to be in one place, so that we can easily remove or upgrade them, or move them to another box without a compiler.
Basic spectrum recording with vlfrx-tools
The vlfrx-tools software follows the unix philosophy: it consists of many small programs, everyone of which has one clear function, it’s up to the user to connect them together to do whatever he wants. Interfacing the programs cam be done in the thaditional unix way using pipes, but also using circular buffers. It important to read how the vlfrx-tools buffer interface works.
To keep things simple we’ll run the software as the root user (it would be more elegant to make an unprivileged user which would have full access to the sound card etc). In case of the EMU-0204 USB sound card the device is visible as the hw:1,0 device in the ALSA subsystem (hw:0,0 is the internal sound card in the laptop). The EMU-0204 card can only sample at 24 bits per sample (other sound cards can also sabple at 16-bit and 8-bit depth, the bits per sample is set using the -b parameter to vtcard).
The hardware setup is described in the Simple setup for monitoring of VLF signals using vlfrx-tools article. A lowpass-filtered 1PPS is connected to the L channel, while the R channel is connected the VLF signal from the antenna.
We’ll place the samples from the sound card in the @rawch1 buffer:
/opt/vlfrx/bin/vtcard -vv -A b=262144,p=2048 -r 48000 -d hw:1,0 -b24 @rawch1
One sould read the documentation how the stream can be marked with 1PPS and resampled using this information.
We’ll observe the 1PPS signal in the @rawch1 buffer using the vtscope program from vlfrx-tools:
/opt/vlfrx/bin/vtscope @rawch1
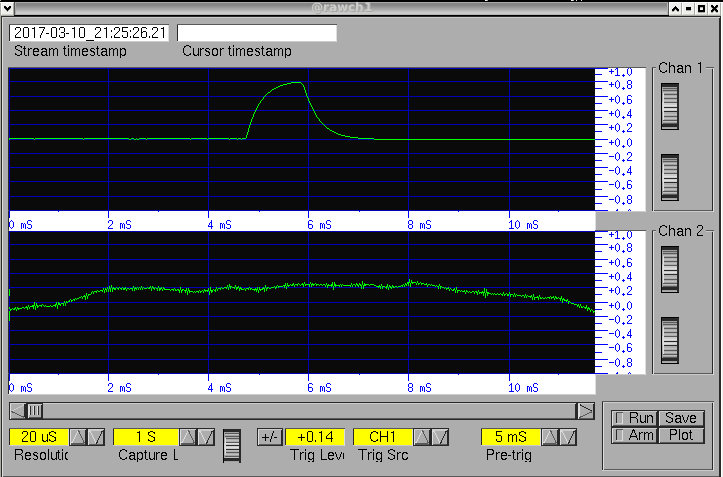
Fig 1. The sound card signal in the time domain, the 1PPS signal is in the first channel
The 1PPS signal should look similar to Fig 1. Please pay attention to the Resolution, Trig Level, Pre-trig settings, the meaning is the same as in an oscilloscope. znaczenie jest podobne jak w oscyloskopie. The 1PPS level sould be set to about 80% of the ADC resolution using the level knob on the sound card.
Now we’ll use the vttime program to resample the signal to the exact rate that is declared by the input signal (in this case 48kHz). As the input we’ll use the @rawch1 buffer, the output signal (after correction) will be placed in the @output1 buffer. We’ll use channel 1 for the reference (-c1 parameter), we’ll correct using the rising edge of the signal (ppsbase+ parameter), the imput pulse has about 1.5ms (the w parameter), and the time difference between the begining of each second and the middle of the pulse is about 100ms (the c parameter):
/opt/vlfrx/bin/vttime -v -c1 -m ppsbase+,c=0.001,w=0.0015 @rawch1 @output1
The buffer @output1 contains a signal which is resampled to exactly 48000 samples per second.
The signal from channel 2 (2 is the R channel – the VLF signal, 1 is the L channel – the 1PPS signal) will be extracted using the vtcat program, and pass it via a pipe to the vtwrite program to save it on disk. This will be saved as 4-byte samples (the i4 parameter, if the source has 16-bit resolution then i2 should be used). The data will be saved to the /mnt/rawvlf directory, and a new file will be created every 3 hours (10800 seconds):
/opt/vlfrx/bin/vtcat @output1:2 -- -,i4 | /opt/vlfrx/bin/vtwrite -v -G 10800 /mnt/rawvlf/
WARNING: the /mnt/rawvlf directory will get bigger with time. Older files should be deleted so that you don’t run out of disk space (this can be done by hand or using a simple script). The /mnt/rawvlf directory is an example, one should use a directory on a filesystem which has adequate free space.
Using the data registered via vlfrx-tools
Having registered the spectrum, we can analyze it. Below you’ll find a few examples:
Fast VLF spectrogram:
/opt/vlfrx/bin/vtcat -E20 @output1:2 | /opt/vlfrx/bin/vtsgram -p100 > /tmp/out.png
The /tmp/out.png file contains a 20 second spectrogram with 100 pixel/second resolution.
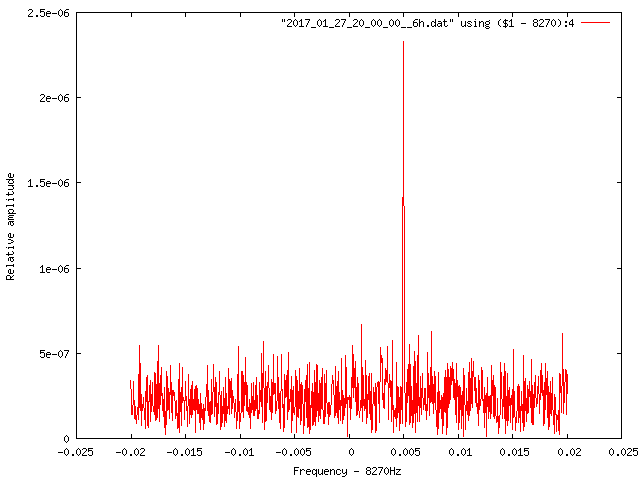
Narrowband signal analysis using a simple script gen.sh (please read the comments):
#!/bin/bash
# simple vlfrx-tools spectrum graph script --sq5bpf

export PATH=$PATH:/opt/vlfrx/bin

gen() {

TI="$1"
PL=`echo "$TI"|tr :,+- ____`
 #vtcat -v -v -p -T$TI |
vtread -T$TI /mnt/rawvlf/ | \
 vtfilter -h bp,f=${F},w=3000 | \
 vtblank -a2 -d0 -t10 | \
 vtnspec -f ${F} -w0.040 -r46.3e-6 > ${PL}.dat

echo "set terminal png small
set output \"${PL}.png\"
 set style data lines
 set xlabel 'Frequency - ${F}'
 set ylabel 'Relative amplitude'
 unset title
 plot \"${PL}.dat\" using (\$1 - ${F}):4
 " | gnuplot


}

#set this to the center frequency in Hz
F=8270

#please use the timestamps in the format YEAR-MONTH-DAY_HOUR:MINUTE:SECOND,+INTERVAL_IN_SECONDS
#in the next line

for i in 2017-01-27_20:00:00,+6h 2017-01-27_23:00:00,+6h
 do
 echo -n "$i start: `date`"
 gen $i
echo " end:`date`"
 done
It’s best to run the script so that it doesn’t compete for disk I/O with other programs, the priority can be set using the ionice tool:
ionice -c Idle ./gen.sh
The script generates specrtum graphs similar to this:
Receiving ebnaut transmissions
The following script extracts the desired interval from out recording repository, filters a 3000Hz band centered on our receive frequency, feeds it to a noiseblanker, and resamples it to a 240 samples/second stream. The data is saved in the file set by the $PLIK variable. The file contents are later passed to vtraw and ebnaut for decoding. One should set the TT variable (the timeperiod which is being analysed), FREQ (the frequency in Hz), and PLIK (the filename containing the extracted 2400sample/second stream). The receiver output is saved to a file, so that one experiment with running ebnaut on it with different parameters.
#!/bin/bash
export PATH=$PATH:/opt/vlfrx/bin
TT=2017-03-11_22:00:00,+30720
FREQ=8270.0333333
PLIK=plik_df6nm_20170311_2

renice -n 10 -p $$

vtread -T$TT /mnt/rawvlf | vtcat -p -T$TT | vtfilter -h bp,f=${FREQ},w=3000 | vtblank -v -a2 -d0 -t10 | vtmult -f ${FREQ} | vtresample -r 240 > $PLIK

vtraw -oa < $PLIK | ebnaut -d -N5 -p 8K19A -S60 -k 16 -r240 -c2 -PS -v
This is a sample of the ebanut decoder output (in this case the message is “DF6NM”):
padded 0.267 seconds at end
initial reference phase 46.9 amplitude 9.668e-02
prep [ 0 0 0 0 0]
found rank 1251 ber 3.8281e-01 Eb/N0 -1.0 M -1.514229536e+00 [N;:4J] ps [ 0 0 0 0 0]
carrier phase: 5.5
carrier Eb/N0: -0.0
carrier S/N: 14.54 dB in 32.6 uHz
elapsed 23
prep [ 1 180 180 180 180]
found rank 0 ber 3.3984e-01 Eb/N0 1.9 M -2.094666243e+00 [DF6NM] ps [ 1 180 180 180 180]
carrier phase: 8.2
carrier Eb/N0: 2.9
carrier S/N: 17.41 dB in 32.6 uHz
elapsed 24
Author: Jacek / SQ5BPF