In the last article i’ve written about a method of automatically finding ZEVS trasmissions, and an analysis of it’s messages: Analysis of ZEVS messages
Luckiny i have data from 25 August 2021 until now. Using it i can check if anything has changed during the Russian invasion of Ukraine in 2022.

These are encrypted military messages. So there is no reason to analyze them, right? 🙂
Is there any sense to analyze ZEVS?
Such an analysis should not be feasible at all. These types of transmissions are encrypted, so we can’t analyze their contents anyway.
Additionally the number of messages in any time period should be more or less the same, do that traffic analysis is not possible. In case when there are no meaningful messages to transmit, dummy messages should be sent, do that the adversary sees the same amount of messages every time period.
So, from the above description one can clearly see that analyzing this traffic is pointless.
But what if the number of messages sent is an average of 2 per day, and there is a need to urgently send more? 🙂
Traffic analysis of ZEVS messages
It is very easy to count the amount of messages sent each day.
All is documented in the github repository: https://github.com/sq5bpf/zevs-analysis i the runme.sh script. The amount of messages per day is in the zevs_messages_perday.txt file. The first column is the date, and the second colums is the number of messages sent this day. Below is a sample framgent of this file:
2021-08-26 2
2021-08-27 4
2021-08-28 1
2021-08-29 1
2021-08-30 1
2021-08-31 1
2021-09-01 1
2021-09-10 1
2021-09-11 1
2021-09-12 1
2021-09-13 1
2021-09-14 1
2021-09-15 1
2021-09-19 1
2021-09-20 3
We can use gnuplot co conviniently make a graph of the data in this file. This is done by the plot.sh script. The while graph is avaliable here:: https://raw.githubusercontent.com/sq5bpf/zevs-analysis/main/zevs_messages_perday.pdf
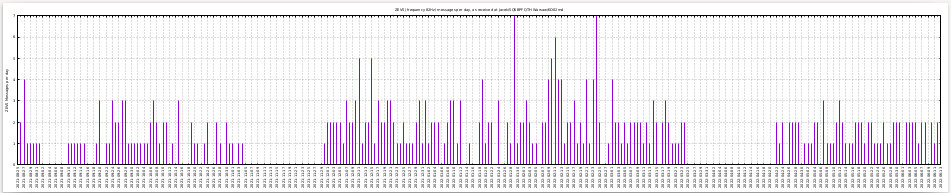
We can see that usually the script detects around 1-3 messages per day. In the days when there are 0 messages either the grabber was down, or the antenna was disconnected (because of thunderstorms etc).
There are quite few days with more than 3 messages detected:
2021-08-27 4
2021-12-11 5
2021-12-15 5
2022-01-19 4
2022-01-29 7
2022-02-09 4
2022-02-10 5
2022-02-11 6
2022-02-12 4
2022-02-13 4
2022-02-21 4
2022-02-23 4
2022-02-24 7
2022-03-01 4
It’s interesting that the peak of activity is a few weeks before the russian invasion of Ukraine in 2022-02-22:
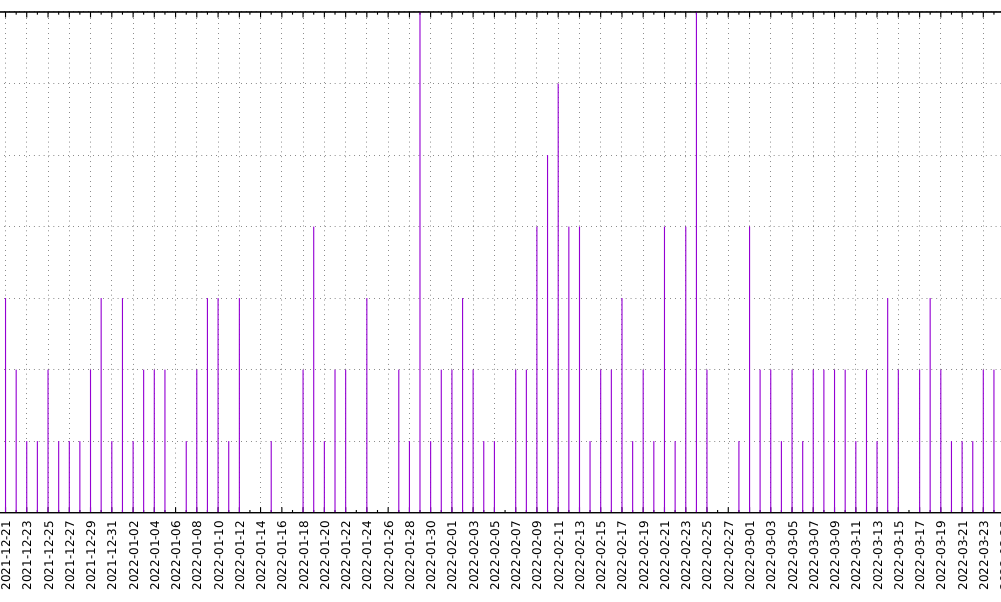
It’s also interesting that beginning march 2022 they were back to sending 1-3 messages per day, so it was back to “business as usual”.
Summary
OI’ve published the spectrum in 80-84Hz in 1 minute intervals from a period of about 9 months (with some pauses in the data): Data from ELF 82-84Hz observations over a few months has been published
I’ve published an analysis of the ZEVS messages: Analysis of ZEVS messages
It seems from this analysis that a short time before the russian invasion of Ukraine in 2022-02-22 more messages were being sent to the russian nuclear submarine fleet.
I hope that others will analyze this data and will try to extend or criticise this analysis. The algorithms used are a quite naive. It would be benifical to manually glance over the data and to see if other messages haven’t been missed by this software.
If you use this work, or have any comments, please send me an email
Author: Jacek Lipkowski SQ5BPF < sq5bpf (at) lipkowski.org >
![]()
This article is published under the Attribution 4.0 International (CC BY 4.0)
https://creativecommons.org/licenses/by/4.0/