Stefan wrote:

> http://abelian.org/vlf/tmp/170211b.png

> How can one produce such a plot from data files produced by
> vtwrite? Can you advice a command line?

First use vtread to extract the signal, vtfilter and vtblank to
clean it up, and vtnspec to produce the spectrum.

 vtread -T2017-02-11_13:30,+7h /raw |   # Extract signal
   vtmix -c 0.866/-20,-0.5/-35,-0.65 |  # Antenna mixing coefficients
   vtfilter -h bp,f=8270,w=3000 |       # Band limit before blanker
   vtblank -a 25 -d0 -t100 |            # Daytime blanker settings
   vtnspec -f 8270 -r 39.68e-6 -w 0.02 > /tmp/170211b.dat

You get 4-columns of ASCII numeric data, column 1 is the frequency
and column 4 the bin RMS amplitude.

I use gnuplot for plotting, because it's easy to script and is
something of an industry standard.  You have to mess about a bit
to get the different colours...  I found filed away the command
I used for that 170211b plot:

echo "
   set terminal png large size 1000,340 background 0x303030
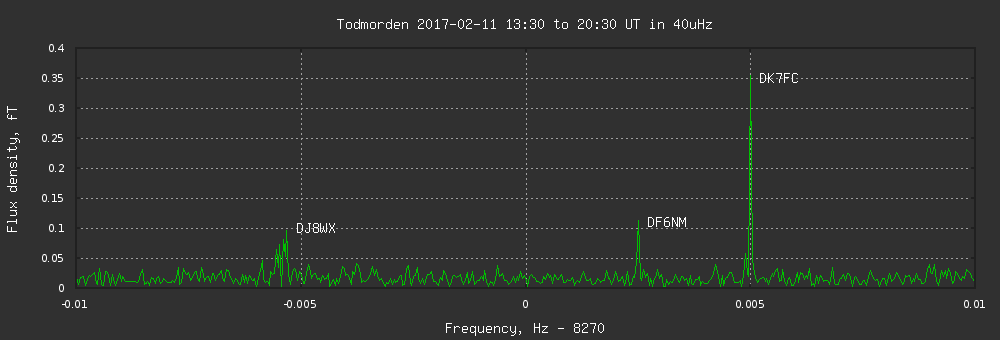
set title 'Todmorden 2017-02-11 13:30 to 20:30 UT in 40uHz'
textcolor rgb 0xffffff
   unset key
   set border lw 2 lc rgb 0x202020
   set xtics textcolor rgb 0xffffff font 'Fixed,8'
   set ytics textcolor rgb 0xffffff font 'Fixed,8'
   set style data lines
   set grid
   set xrange [-0.01:0.01]
   set xlabel 'Frequency, Hz - 8270'  textcolor rgb 0xffffff
   set ylabel 'Flux density, fT'  textcolor rgb 0xffffff
   set label 'DF6NM' at 0.0027,0.11 textcolor rgb 0xffffff
   set label 'DJ8WX' at -0.0051,0.10 textcolor rgb 0xffffff
   set label 'DK7FC' at 0.0052,0.35 textcolor rgb 0xffffff
   plot '/tmp/170211b.dat' using (\$1 - 8270):(\$4 * 1275000/2/0.9) lc 2
 " | gnuplot > /pan/vlf/web/tmp/170211b.png

The field numbers such as $1 and $4 need the dollar to be escaped
with backslash otherwise the shell picks them up.  The magic number
1275000/2/0.9 is the coefficient to convert stream amplitude to fT.

For anything but the simplest plot, I put the gnuplot commands into
a script to echo them into gnuplot.  You always have to run it
several times to get it right so the script saves work.

Long ago gave up finding names for plots and scripts, there are so
many, now I just number them with the date and it makes them quite
easy to track down in the filesystem, even decades later - so long
as I know the approximate date.  The above script was named plot170211b.
Well worth having some sort of system - you end up after several years
with many thousands of data files, scripts and images.

--
Paul Nicholson
--
|