Here is my reception report...
Transmitter: Amateur radio station DK7FC transmitting from
49.77647N 8.699525E, (near Frankfurt) on 8970 Hz, ERP estimated
at up to 1.7mW, vertically polarised CW.
Receiver: Todmorden, UK, 53.703N 2.072W. Orthogonal loops,
20 square metres each, LT1028 front-end, system sensitivity
0.03fT in 5mHz bandwidth. Frequency locked to MSF at 60kHz.
The distance to the transmitter is 858.7 km, bearing 116.2 deg.
Test date: 2010-03-15. All times UT.
Flux density error: +/- 50%.
Transmitter website http://www.qrz.com/db/DK7FC
Receiver website http://abelian.org/vlf/nb.shtml
Observations
------------
The signal appeared faintly in the 0.005Hz/200 second
spectrogram between 14:30 and 16:00. The spectrogram was
produced from the loop signal oriented to null the
prevailing background noise which averaged 1.56 fT in 5mHz
on mean bearing 162/342 deg. The signal was not visible in
a omni-directional spectrogram.
After orienting the loops to null the average background,
the remaining noise averaged 0.73 fT in 5mHz. All further
analysis refers to the oriented signal.
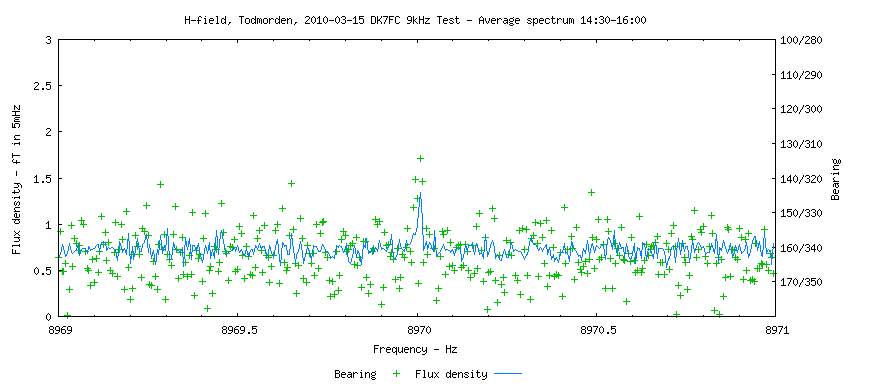
A graph of the (non-coherent) average flux density over the
90 minute period is shown here,
http://abelian.org/vlf/ss100315/p1.png
The standard deviation is 0.085fT and the peak at 8970.01 Hz
is 1.34fT, which is 7.2 sigma away from the mean background.
The signal is spread somewhat across three frequency bins,
due either to tx modulation or propagation. If the signal
energy represented by the three bins is combined, the
resulting average signal amplitude is 2.2fT.
The averaged bearing is 135 degrees, which agrees very well
with a signal-amplitude weighted average of the transmitter
on 116 degrees and the noise on 162 degrees.
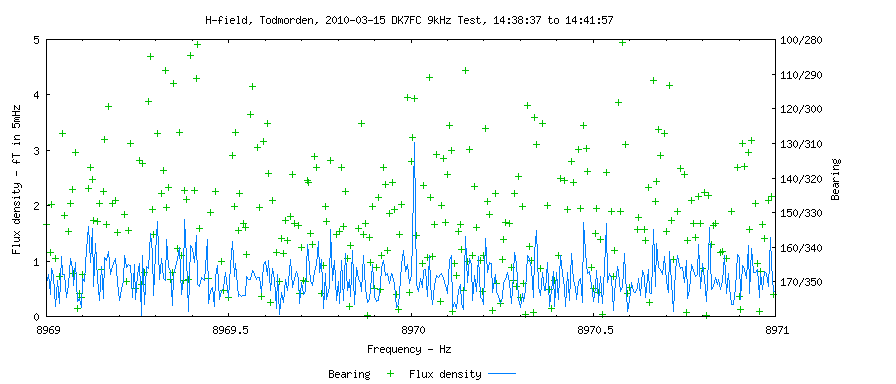
Only in one 200 second integration period did the signal show
clearly above noise. This was 14:38:37 to 14:41:57, in which
we have significant energy concentrated into a single bin at
8970.01 Hz, amplitude 3.1fT with a bearing of 117/297 deg.
http://abelian.org/vlf/ss100315/p2.png
The noise in this spectrum has mean 0.70fT and standard
deviation 0.365fT which puts the peak at about 6.6 sigma
above the mean.
To estimate the significance of this peak, a 7 hour period of
data was scanned to look for peaks of height > 6 sigma relative
to each 200 second integration frame. The period chosen was
09:00 to 16:00 during which the background noise had similar
amplitude to that present during the test. In 126 frames and
50400 bin samples, no other peaks were found with higher sigma.
The nearest was one at 15:35:23 on 8969.9297 Hz with a peak
of 3.2 fT, bearing 108 deg and a sigma of 5.5. This peak
is 80mHz below the transmit frequency.
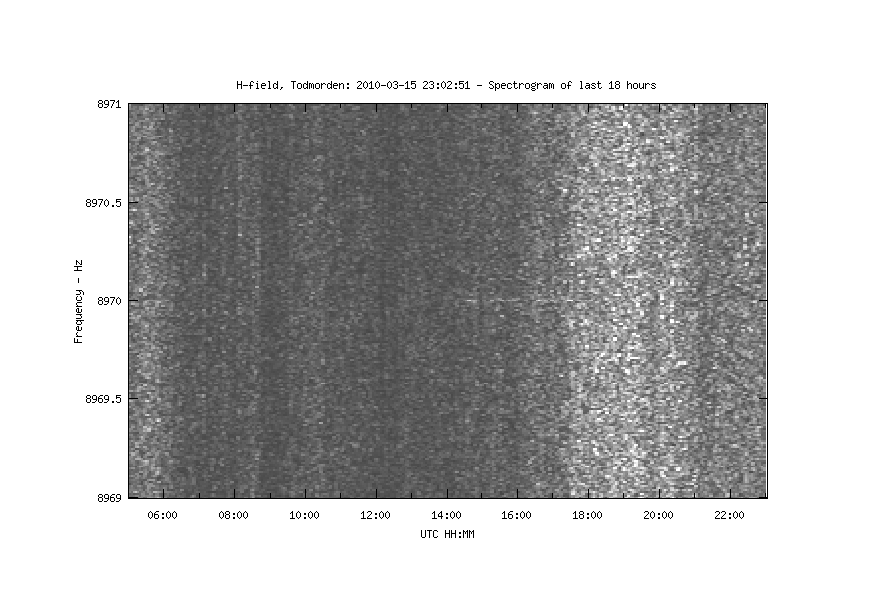
A spectrogram of the band is at
http://abelian.org/vlf/ss100315/sg1.png
The signal is visible faintly before the noise starts to rise
at 16:00. Markus Vester (DF6NM) has made a visual alignment
of this spectrogram with the signal he received at Nürnberg
at a range of about 180km,
http://abelian.org/vlf/ss100315/8k97_100315_14-18UT.jpg
Notes/Comments
--------------
Here is the daily chart for DHO on 23.4kHz,
http://abelian.org/vlf/live/100315.DHO.png
The ionosphere begins to be disturbed from 15:00 onwards.
(The small 'SID' shortly before 10:00 is actually a 62.7
second outage of DHO.) Fluctuation of bearing and phase angle
(between the two loops) indicates multiple signal paths arriving
on different bearings.
The test would have been better performed earlier in the day.
During the morning the noise was very low and bearing about
25 deg which left the beam of the antenna pointing directly
at Frankfurt!
Rapid keying, such as QRSS 120, is too fast for this frequency
resolution. A long CW transmission would be more useful
scientifically. At times, path length fluctuation will spread
the signal outside of a 5mHz filter. In this situation there
is no benefit to using even narrower bandwidth. With further
CW tests it should be possible to estimate a minimum usable
daytime bandwidth.
The signal detection here is quite satisfactory when regarded
as a physical measurement. However, for amateur radio record
purposes it is appropriate to require a message or at least
a callsign to be decoded. At this S/N ratio and bandwidth it
would probably require QRSS 300 or greater and take a few hours
to send a callsign. This might be reduced if a synchronous
FSK mode was used.
It is not clear what to make of the peak at 15:35:23 on
8969.9297 Hz which is quite a significant peak 80mHz below
the transmit frequency. Doppler shift due to path length
changes are to be expected, but this amount of shift requires
a sustained rate of increase of path length of 2.6km/sec.
In the same integration frame, the signal at 8970.01 Hz was
about 2.1fT.
The average signal strength was 1.34fT during the 90
minutes analysed. For part of that time, the transmitter
was off, and the signal energy is spread across about 15mHz.
Considering this, the signal amplitude was probably around
3fT which is rather higher than an estimate of 0.9fT derived
from 1.7mW ERP.
On the spectrogram is visible another intermittent narrow
band signal at about 8970.1Hz, rather fainter than DK7FC.
This signal is too weak to analyse.
During the test, no lightning was present in Europe. Only
weak, distant sferics were present and the sferic blanker
was removing about 3% of the signal.
Conclusion
----------
This signal detection at 857km is very encouraging and we
await further tests. Undoubtedly before too long the first
amateur radio message will be sent across more than 100km
at 9kHz and this test suggests that much higher range may
be possible. Daytime, mid-morning to early afternoon probably
offers the best propagation and background noise. The DHO
chart indicates that the D layer is stable during this time,
and the background noise is at its lowest. For amateur radio
purposes it is important to modulate the signal. For scientific
analysis of propagation, a continuous signal is more useful.
Hopefully future tests can accommodate both requirements.
--
Paul Nicholson
--
|