|
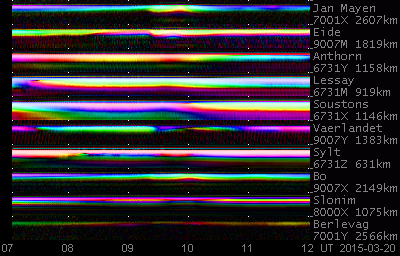
The output from LoranView is a time domain
representation of the pulses, displayed with a fast horizontal axis and a slow
vertical axis. There is one slot for each observed station, with stations
generally sorted from west (left) to east (right). Within a slot, the
received pulseshape is shown with pixels corresponding
to 22050 samples per second, so later skywave components appear
further to the right. The slow vertical axis goes from bottom to
top at the averaging rate, normally five minutes per pixel. Signal
strength is shown as brightness, and phase as colour, advancing from red to
green to blue.
The attached colour graph is the original
output, but rotated to the right for easier comparison with the plots. Thus
the most westerly station (Jan Mayen) is at the top, and
Berlevag at the bottom. The fast axis is downward, and the slow axis to the
right.
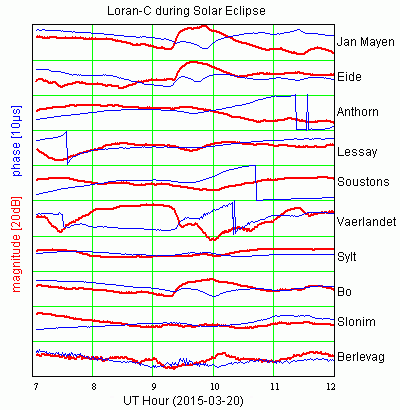
The magnitude / phase plots have been derived from
the raw bitmap output. Each box shows a 20 dB range of relative
fieldstrength (received pulse energy, red), and a 360° range of
phase change (blue, downwards means more lag).
The most obvious effect happened on the Jan Mayen
trace, where totality crossed the path at about 9:45. The skywave
intensity goes up (less absorption), and the phase shows some extra delay
(yellow trace). This is expected from the temporarily increased height
of the ionospheric waveguide - an opposite effect can often be observed during
solar flares where the D-layer is being pushed down. The Ejde
transmitter on Faroes happened to be within totality and is also strongly
and suddenly affected.
The more easterly stations see a generally
weaker effect as the path runs through the partial eclipse zone
(penumbra). Only Verlandet seems to be somewhat special in that the
phase change apparently produced a signal cancellation near 10:00
UT.
The plots have also been uploaded to http://df6nm.bplaced.net/LoranView/eclipse/ .
This folder also contains
a snippet from an older observation, showing Jan Mayen and
Ejde traces during the eclipse on Aug 1st, 2008, and the day after for
comparison (five minutes per pixel).
I would have loved to observe an effect on the
VO1NA 137.777 kHz signal, but due to adverse auroral
conditions and unfavourable weather at the TX site, the daytime signal was
simply too weak to be detected here. Thanks anyway to Joe for attempting this
experiment!
All the best,
Markus
|