Paul Nicholson wrote:
                                I'd like to see a plot of signal strength
against distance for 70km ionosphere and see how it compares
with the simple model in
Hello Paul, LF(VLF) Group,
sorry for the delay with my answer...
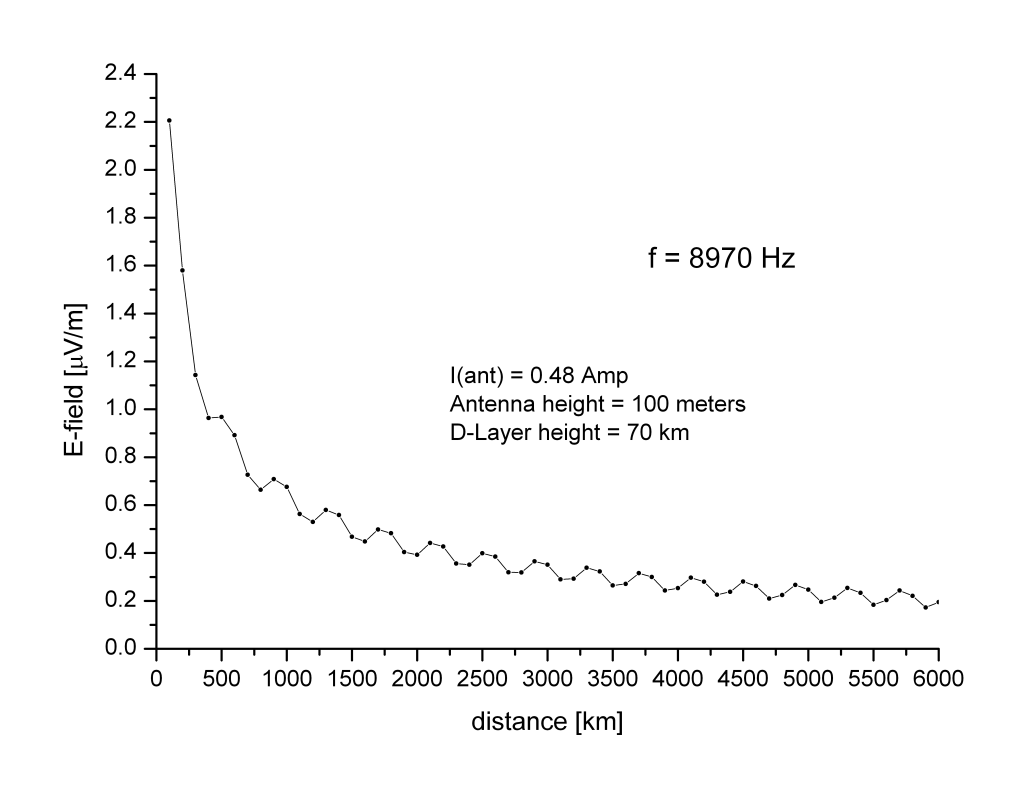
i have attached two figures. In the plot1.png file one can see
calculated signal strength
against distance with assumed D-layer height of 70 km.; f = 8.97 kHz
The decrease of signal strength does not have a strictly monotonic
character - it 'oscillates' i.e.
we have 'local' min and max values wrt the distance. For lower
frequencies , say, up to 5-6 kHz
the decrease is strictly monotonic - i've tested only a couple
frequencies so i can not say precisely what is
the frequency 'threshold' for such an 'oscillatory' behaviour for this
particular
earth-ionosphere waveguide propagation model.
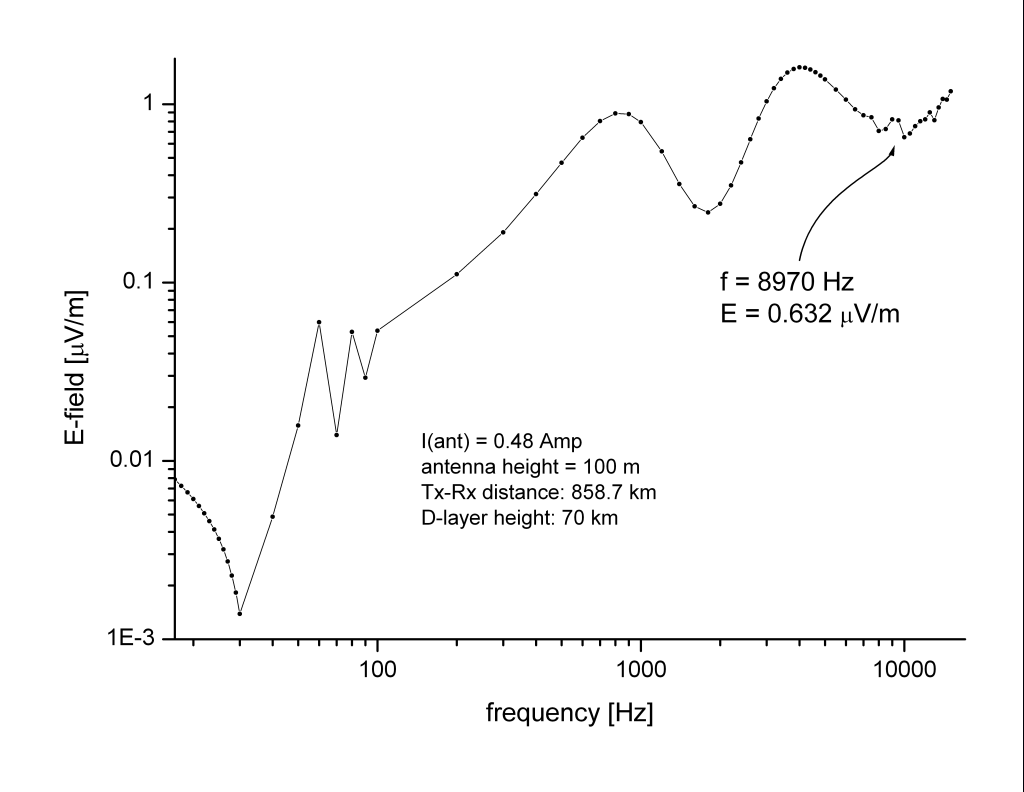
In the second figure ( plot2.png file) i have simulated wide-band
behaviour of that model so for the fixed distance of 858.7 km
(this was an arbitrary choice for fixing the distance)
and the same antenna parameters ( Stefan, dk7fc 2nd vlf tx'ing) there
is a plot of signal strength versus frequency
(please, note the logarithmic scales)
One can see relatively big attenuation around 2 khz ( so called
waveguide cutoff frequency ) and some 'resonances' when going into ELF
region
sorry for the 'coarse' sampling of frequencies taken for calculations
but i simply wanted to check (quickly) both the wide-band properties
of the earth-ionosphere waveguide as well as its present numerical
implementation.
Yours, Piotr, sq7mpj
qth: Lodz /jo91rs/


|

