Stefan was kind enough to put me in the loop on this experiment,
a couple of days ago sending me a bunch of daily .wav files and
asking for comment on the significance of the data. There was
an obvious clear peak in the spectra at the expected frequency,
that was with 11 repeats of the transmission.
I ran LWPC for the path and saw immediately that it matched
quite well the chart that Stefan had produced showing S/N in
a range of bandwidths. LWPC predicted only a brief period
of stable phase, from roughly 19:00 to 21:30 UT.
Running my own stacking produced the same peak that Stefan was
reporting. The S/N was about 12dB which is a significant peak
and one which we would normally readily accept as a result.
But this is such an extraordinary achievement, Stefan felt
that it needed a more confident analysis. Especially as we
are stacking multiple repeats and there's a potential there
for artifacts and bias to creep in.
With a genuine weak signal, we expect the S/N to more or
less improve as more repeats are added. There can be the odd
setback if a noisy day is added, but generally more repeats
should give higher S/N.
It should also be possible to see the signal when stacking
non-overlapping subsets of the available repeats.
To test these I set a spare machine to run all combinations
of the 11 files: 2047 stacking permutations, and I ran each
permutation with a range of start times and bandwidths.
There were around 21000 spectra to analyse and the 17470.1
Hz peak was a prominent result. There were 7 peaks on other
frequencies with slightly greater S/N. All of these occurred
with stacking 7 or fewer files.
The following day, another repeat was available and I re-ran the
trials, this time with 53261 spectra and a total of 589626765
frequency bins. Only two bins had slightly higher S/N than
the genuine peak. One came from stacking just three files,
the other from six files.
Very encouraging to see the significance increase like this with
the extra day. I also compared combinations of non-overlapping
subsets of repeats and found 37 pairs. This shows that the
signal isn't just present on a few of the days. It would be
highly unlikely to find even one pair sharing the same random
noise peak.
It was also apparent that the optimum start time was around
19:10 with duration 2.5 hours - a bandwidth of 111.1 uHz.
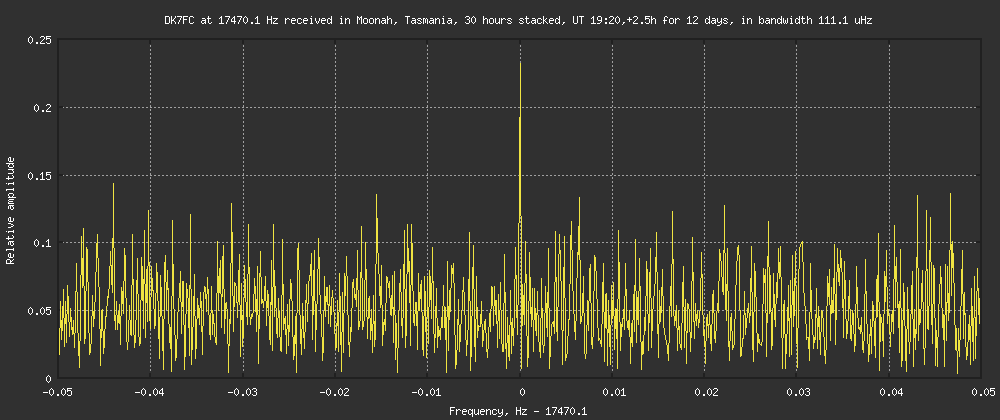
A final day arrived and this time 122865 spectra were examined.
A total of 1326819135 frequency bins and the best peak out
of all of them was 14.13 dB S/N in 111.1 uHz at 17470.1 Hz,
a 2.5 hour duration beginning 19:20 UT. This was with a stack
of 12 repeats (dropped the 26th March). The stack of all 13
repeats gave S/N 13.95 dB.
There were no other higher peaks in the 1.3 billion Fourier
bins. Here is the winning spectrum:
http://abelian.org/vlf/tmp/180406c.png
The probability of any particular bin reaching this S/N
by chance against a Rayleigh bin amplitude distribution is
about 2.4e-9.
From a total of 122865 spectra which checked every permutation
(8191) of 13 files, with 15 combinations of bandwidth and start
time, 21611 spectra peaked at 17470.1 Hz. No other frequency
came close to that, the next best being 17470.0542591 Hz with
2318 trials producing that peak.
17470.1 Hz was the strongest peak in:
The 13-stack;
All 13 12-stacks;
All 78 11-stacks;
All 286 10-stacks;
672 of 715 9-stacks;
1084 of 1287 8-stacks;
when the above are measured in 111.1 uHz from 19:20 UT.
We can clearly see the genuine signal becoming dominant
as more repeats are stacked.
I see no way to avoid the conclusion that this is a genuine
detection of a ~2mW VLF carrier at a distance of 16805 km,
about 85% of the way to the antipodal point. This completely
smashes all previous VLF distance records. It is all the
more remarkable due to the narrow time window where the
phase is stable.
--
Paul Nicholson
--
|