Hi Dex,

you wrote:
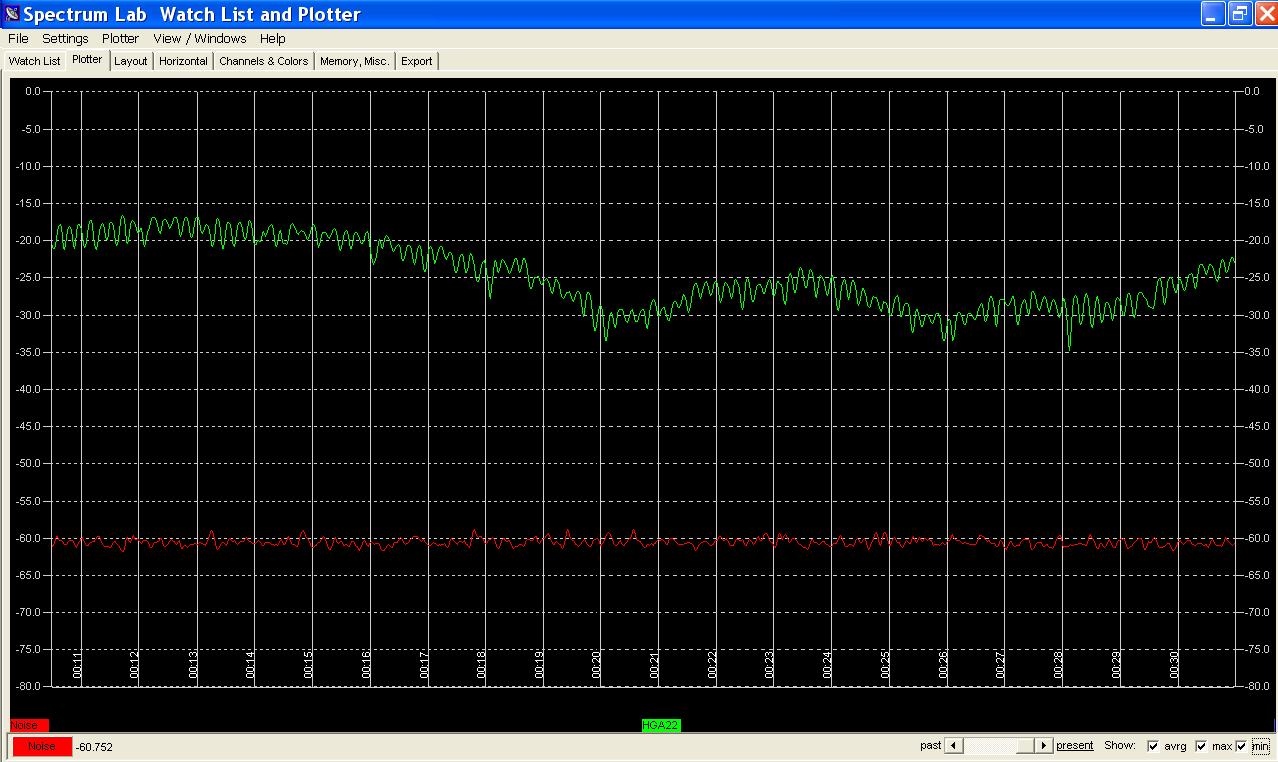
I had moved the plot to 60 khz before I read your suggestion Wolf.
Here's what I am seeing tonight:

http://www.w4dex.com/lf/HGA22_0030_19feb11.jpg
Interesting, the sine-shaped pattern is still there - and the
'oscillation' frequency is suspiciously constant.
Would be interesting to see an FFT of the signal strength plot, to see
how stable the frequency of the 'AM' is. To do that, one would have to
export the data as a text file (which is possible), and import it into
some post-processing software like matlab (which I don't have myself).
Which function (especially the observed bandwidth for that signal) did
you use to plot it, the peak function or the power (or effective
voltage), in which frequency range ?
I'd like to plot the same signal with the same BW here, just for
comparison. I don't think I will have two different reflective layers on
the signal path...
73,
  Wolf .
|