Hi Edgar,
Similar results here, not too spectacular for such a strong signal.
The signal was very narrow-band filtered so perhaps the reassigned
spectrogram looks poorer than it should be (if there was sufficient
'background noise').
Anyway zooming into the frequency axis shows good frequency
resolution..
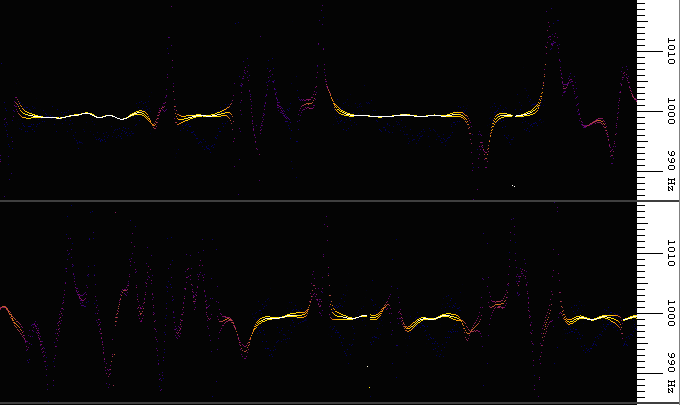
.. especially considering that the FFT frequency bin width was 62
Hz, the read out resolution is much better (almost 1 Hz).
FFT parameters used for the above analysis: Hann window, 128 point
FFT.
Effect of FFT settings with fs= 8.00000 kHz:
Width of one FFT-bin: 62.5000 Hz
Equiv. noise bandwidth: 93.7500 Hz
Max freq range: 0.00000 Hz .. 4.00000 kHz
FFT window time (length): 0.016 s
FFT window overlap: 75.0 %
I adjusted the contrast and brightness so that the residual noise
(or is it 'filter ringing') also leaves a trace on the spectrogram.
There was a short "pop" audible in the recording, visible in the
center dot of the "s" at the bottom which shows that the time
resolution is also ok.
Cheers,
Wolf .
|
|