Hello Bob,
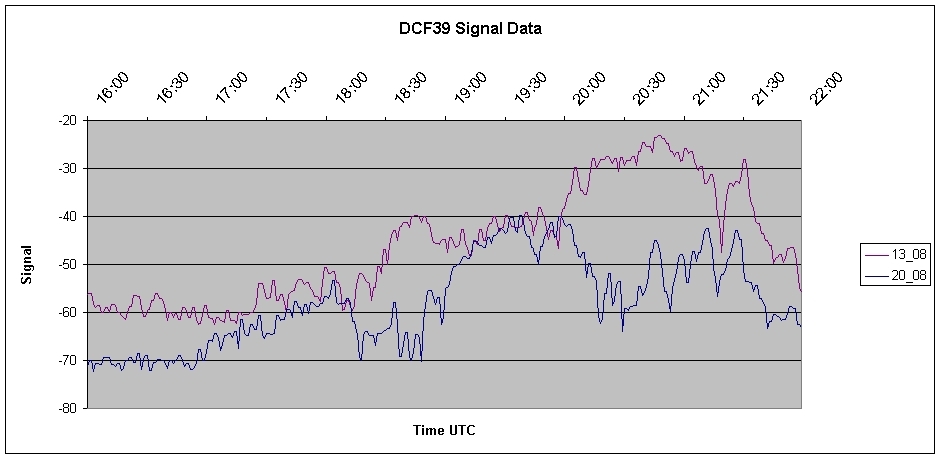
Thank you for the graphs.
Well that looks promising. But there are some open questions on the
graph. The data is collected by SpecLab and then exported to Excel.
Was a noiseblanker applied to the input signal? (it shouldn't)
Is the noise plot normalized to 1 Hz noise bandwidth (_expression_:
"noise_n" in SpecLab)?
Does the DCF signal level relate to a 1 Hz noise bandwidth spectrogram
("Width of one FFT-bin: 732.422 mHz" and "Equiv. noise bandwidth:
1.09863 Hz" is typical) ?
These are important settings to be taken in account. If so, then i
think there are real chances to get some traces again and it is worth
to try!
Vy 73 from Heidelberg
Stefan/DK7FC
Am 21.07.2012 01:53, schrieb Bob:
Here are my plots for the last two weeks.

Bob VK7ZL
On 21/07/2012 02:24, Stefan Schäfer
wrote:
Hello all,
Dimitris recently added the DCF39 plot to his grabber site again, http://people.physics.anu.edu.au/~dxt103/grabber/
The plot was very useful in the last DX season back in March 2012.
However it just shows about 10 dB S/N these days. But the DCF
spectrogram which was available on the site since a longer time often
showed levels above 20 dB S/N which would be most suitable for the
tests. So now the question is if the condx are actually as good as i
thought a few days ago or if we would have to wait another few weeks,
maybe 4.
What do the other DX experts think about the current situation on that
path? Suggestions?
73, Stefan/DK7FC
--
LF/HF QRSS Grabber: http://tinyurl.com/26callh

NDB & Navtex Logging: http://tinyurl.com/255zfm2
|
|

