VLF,
Almost every day i see that the difference between maximum and minimum
of the QRN on 6,34 kHz is about 20 dB while it is just about 10 dB on
8,97 kHz.
Has anyone experiance if this is an advantage or disadvantage? Maybe
Peter/DF3LP?
Below there is the message of Piotr/SQ7MPJ, who calculated, that the
range of 6 kHz is more suitable than 9 kHz. This calculation is for UK.
I hope it is valid generally(?)
Yesterday i rolled out the 200m braid and prepared a suitable 200m wire
(telephone drop wire; copper+steel). The wire plus the braid has a
weight of about 3 kg. So i hope the kite will be strong enough. The
braid has a capability of 260 kg but this is not too much. It seems to
be much more effort to arrange all that but it will be done.
73, Stefan *meltinginthesun@37°C*
PS: Piotr, do you have time and motivation to calculate further
detailed propagation curves for 6,34? :-)
-------- Original-Nachricht --------
Paul Nicholson wrote:
> I'd like to see a plot of signal strength
> against distance for 70km ionosphere and see how it compares
> with the simple model in
>
Hello Paul, LF(VLF) Group,
sorry for the delay with my answer...
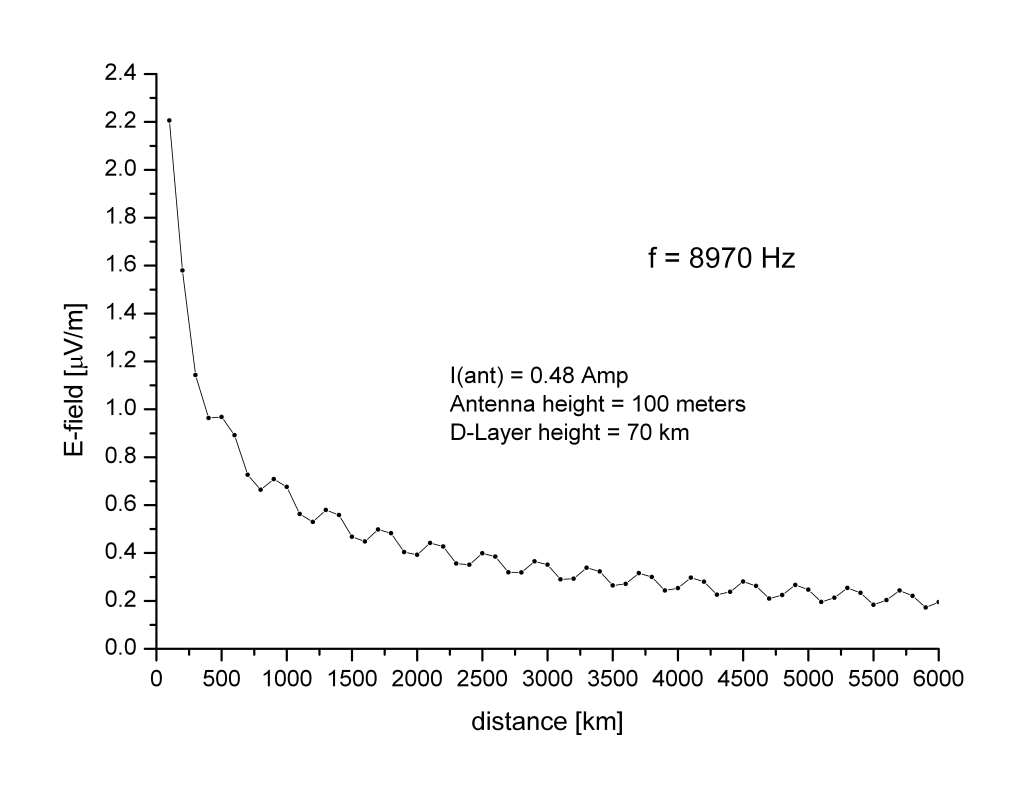
i have attached two figures. In the plot1.png file one can see
calculated signal strength
against distance with assumed D-layer height of 70 km.; f = 8.97 kHz
The decrease of signal strength does not have a strictly monotonic
character - it 'oscillates' i.e.
we have 'local' min and max values wrt the distance. For lower
frequencies , say, up to 5-6 kHz
the decrease is strictly monotonic - i've tested only a couple
frequencies so i can not say precisely what is
the frequency 'threshold' for such an 'oscillatory' behaviour for this
particular
earth-ionosphere waveguide propagation model.
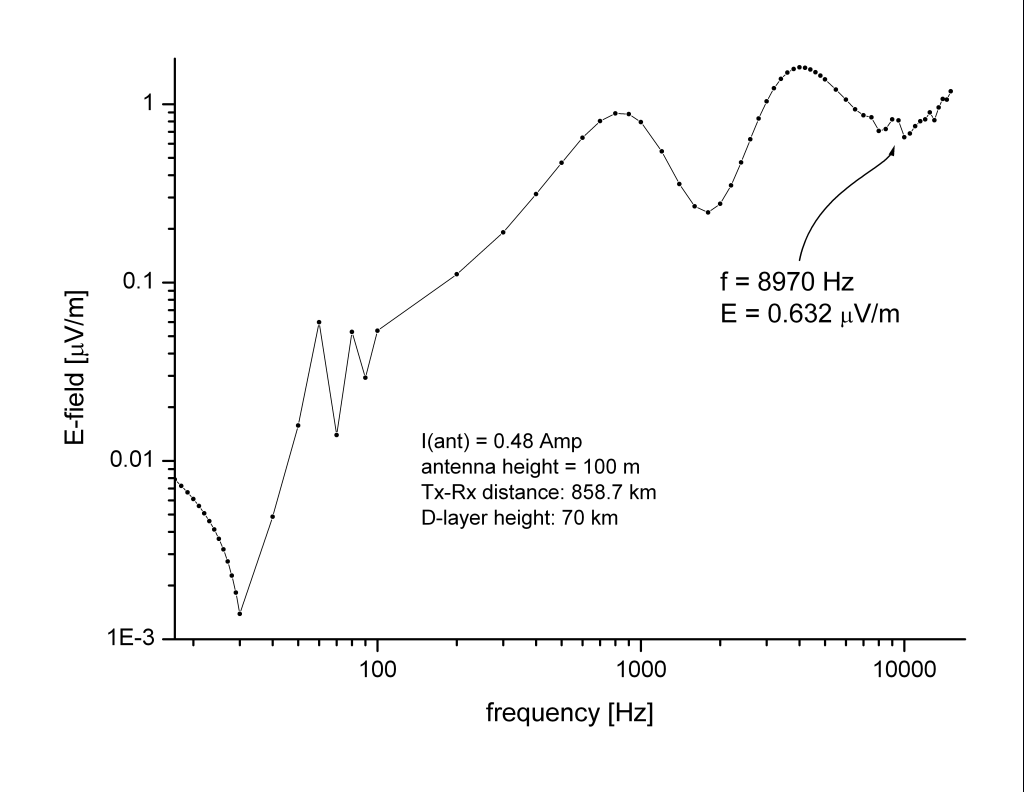
In the second figure ( plot2.png file) i have simulated wide-band
behaviour of that model so for the fixed distance of 858.7 km
(this was an arbitrary choice for fixing the distance)
and the same antenna parameters ( Stefan, dk7fc 2nd vlf tx'ing) there
is a plot of signal strength versus frequency
(please, note the logarithmic scales)
One can see relatively big attenuation around 2 khz ( so called
waveguide cutoff frequency ) and some 'resonances' when going into ELF
region
sorry for the 'coarse' sampling of frequencies taken for calculations
but i simply wanted to check (quickly) both the wide-band properties
of the earth-ionosphere waveguide as well as its present numerical
implementation.
Yours, Piotr, sq7mpj
qth: Lodz /jo91rs/
|
 plot1.png
Description: PNG image
plot2.png
Description: PNG image
|